Linear Regression: Interpolation, Extrapolation & Traps (IB Math AA/AI)
In the world of IB Mathematics (both Analysis & Approaches and Applications & Interpretation), Statistics is often viewed as the “easy marks” section. However, this is exactly where students lose the most points due to lack of precision. Specifically, when dealing with IB Math Linear Regression interpolation vs extrapolation, the definitions must be exact, and your methodology for predicting values must be flawless.
Whether you are working on your IB Math IA statistics or preparing for Paper 2, understanding the difference between predicting within your data range and guessing outside of it is critical. Furthermore, there is a specific “trap” regarding which regression line to use (X on Y vs. Y on X) that catches out thousands of students every year. This guide covers the essential theory, the calculator tricks, and the logical pitfalls you need to avoid.
The Core Concepts: Line of Best Fit & Correlation
Before diving into predictions, we must establish what a linear regression actually is. In IB Math, we generally look for a linear relationship between two variables, typically plotted on a scatter diagram line of best fit.
The standard equation for a regression line is:
y = mx + c \quad \text{or} \quad y = ax + b
Here, x is the independent variable (horizontal axis) and y is the dependent variable (vertical axis). The strength of this linear relationship is measured by the correlation coefficient r (Pearson’s correlation).
Visualizing the Reliability
The closer |r| is to 1, the stronger the correlation. However, a strong correlation does not automatically mean your prediction is valid. Validity depends entirely on whether you are interpolating or extrapolating.
Interpolation vs. Extrapolation: The Comparison
When you are asked to “estimate” or “predict” a value using your regression equation, you must justify whether that prediction is reliable. This comes down to the range of your raw data.
Feature
Interpolation
Extrapolation
Definition
Predicting a value inside the range of the existing data set.
Predicting a value outside the range of the existing data set.
Reliability
High. We have evidence that the linear trend exists here.
Low. We do not know if the trend continues (it might curve or stop).
Example
Data Range: 10 \leq x \leq 50. Predicting for x = 42.
Data Range: 10 \leq x \leq 50. Predicting for x = 500.
Exam Keyword
“Reliable”, “Appropriate”
“Unreliable”, “Inappropriate”
The “X on Y” Regression Trap
This is the concept that separates a Level 5 student from a Level 7 student. Most students habitually calculate the regression line of y on x (standard y = ax + b). This line minimizes the vertical distance (residuals) between the points and the line.
However, IB questions will sometimes ask you to predict a value of x given a value of y.
The Golden Rule of Prediction
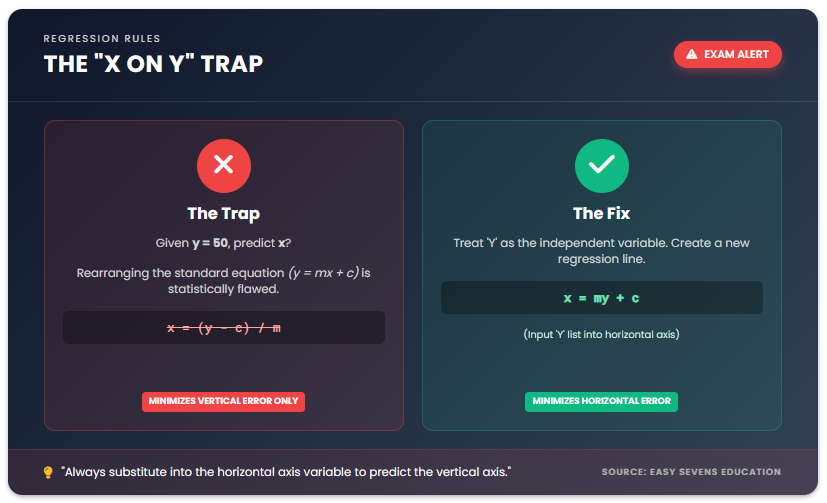
You must always substitute into the horizontal axis variable to predict the vertical axis variable.
Scenario A: You have an equation y = 0.5x + 10. You are given x = 20. You substitute 20 into x to find y. This is mathematically valid.
Scenario B (The Trap): You are given y = 50 and asked to predict x. Most students: Rearrange the equation 50 = 0.5x + 10 and solve for x. The Reality: This is often considered statistically incorrect in rigorous contexts because the regression line was calculated to minimize vertical error, not horizontal error.
If the IB requires high precision (especially in HL), or if they explicitly ask for an X on Y regression line, you must calculate a new regression where x is the subject:
x = my + c
In this scenario, you input your lists into the calculator but treat the “Y” list as the independent variable. This gives you a specific equation to predict x values reliably.
Note: While some mark schemes “condone” rearranging the standard formula if the correlation is very strong, the statistically “appropriate” method is to use the specific regression line for the variable you are trying to predict
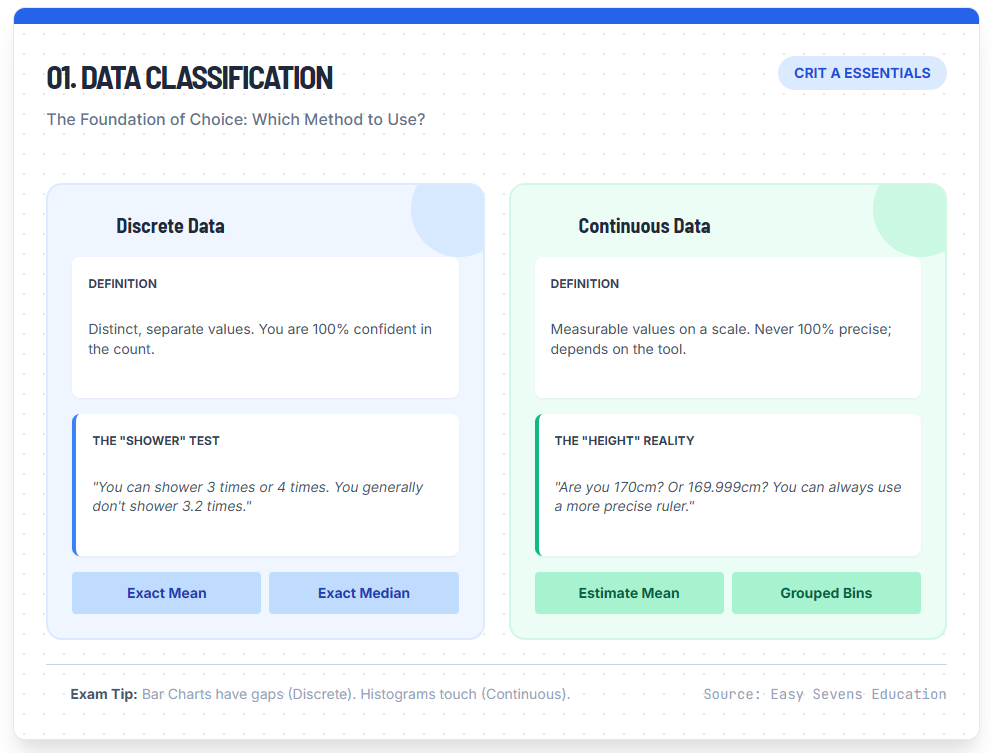
Data Transformation: Center vs. Spread
Another common question involves how changes to the data affect the statistics. If you take a dataset and modify every number, how do the Mean (Center) and Standard Deviation (Spread) change?
1. Adding/Subtracting a Constant
If you add k to every data point:
Measures of Center (Mean, Median): The value increases by k. The graph shifts, but the shape stays the same.
Measures of Spread (Standard Deviation, IQR, Range): These stay the same. The distance between points has not changed.
2. Multiplying/Dividing by a Constant
If you multiply every data point by k:
Measures of Center: Multiplied by k.
Measures of Spread: Multiplied by k. The graph stretches, so the points are further apart.
Calculator Guide: Finding the Correlation Coefficient
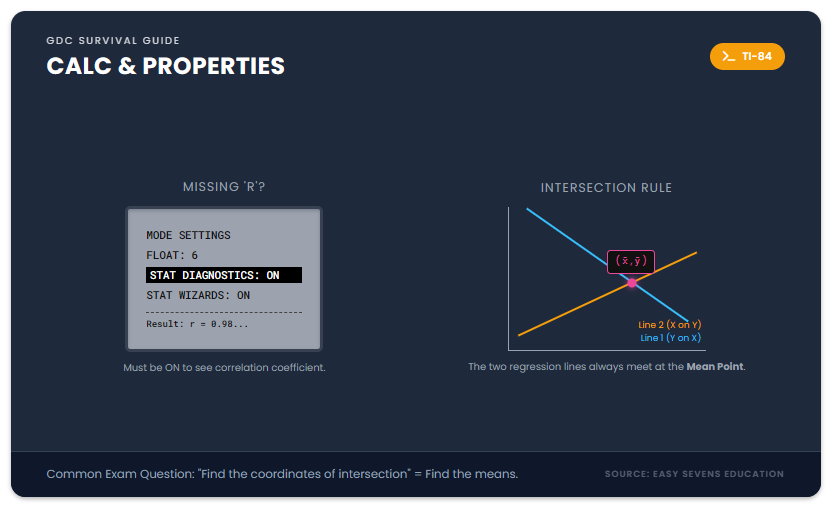
Many students panic during the exam because their correlation coefficient r calculator function isn’t showing up. By default, many GDC (Graphical Display Calculators) have “Diagnostics” turned off.
Go to Mode/Settings: Look for “Stat Diagnostics.”
Turn it ON: If this is off, the calculator will show a and b, but not r or r^2.
Calculate: Go to Stat > Calc > LinReg (ax+b).
Remember, r tells you the strength and direction. r^2 (Coefficient of Determination) tells you the percentage of variance in the dependent variable that is predictable from the independent variable.
Related Resources
Mastering Statistics is just one pillar of the IB Math syllabus. To ensure you are fully prepared for your IA and external exams, it is crucial to connect these concepts with other areas of the curriculum. For example, understanding how variables behave is essential when tackling IB Math Analysis and Approaches questions regarding functions. Additionally, if you are an AI student, these statistical concepts are the foundation of your course; reviewing our guide on IB Math Applications and Interpretation will provide further context on hypothesis testing and distributions.
Frequently Asked Questions
Is predicting x from y always incorrect using the standard line?
Mathematically, you can rearrange the equation. However, statistically, the "Line of Y on X" is optimized to minimize vertical error. To be strictly accurate, especially in HL or IA work, you should calculate the "Line of X on Y" to predict x values.
What is the intersection point of the two regression lines?
The line of y on x and the line of x on y always intersect at the mean point of the data: (\bar{x}, \bar{y}). This is a common exam question where you must find the mean of both variables to find the intersection.
Does extrapolation always mean the answer is wrong?
Not necessarily "wrong," but "unreliable." In an exam, if asked to comment on the validity of a result derived via extrapolation, you must state that it is unreliable because we do not know if the linear trend continues outside the data range.
How do I interpret the correlation coefficient r?
r ranges from -1 to 1. A value close to 1 implies a strong positive linear correlation. A value close to -1 implies a strong negative correlation. A value near 0 implies no linear correlation.
Why does adding a constant not change the standard deviation?
Standard deviation measures the "spread" or distance between data points. If you shift all points up by the same amount (addition), the distance between them remains exactly the same, so the spread does not change.
Conclusion
Statistics in IB Math requires a shift in mindset. You aren’t just crunching numbers; you are evaluating the validity of those numbers. Remember the golden rules: Interpolation (inside range) is reliable, Extrapolation (outside range) is risky, and you should always be wary of the X on Y prediction trap. If you are struggling to make sense of your calculator or need help structuring your Math IA, don’t leave your grade to chance. At Easy Sevens Education, we specialize in demystifying these complex IB criteria. Contact us today to schedule a session and ensure you secure that Level 7.