The chi-square critical value is a statistical value used in the chi-square test to determine whether the differences between observed and expected data are significant. In simpler terms, it is like a threshold that helps in determining if the relationship between categorical variables in a study is real or if it could likely occur randomly.
The critical value of Chi-square is determined based on the degree of freedom and significance level. In statistical notation, chi-square is denoted by χ2. It is important to note that the symbol χ differs from the standard letter X.
In this article, we are going to explore the concept of chi-square critical value that is often tested in IB Maths AI at both SL and HL. We will learn how to find out the critical value of the chi-square and how to use it in the chi-square test. Moreover, we will solve some examples of finding chi-square to help in better understanding.
What is Chi-Square Critical Value?
The chi-square test uses the critical value of chi-square to identify whether there is a significant relationship between categorical variables. To do this, the χ² critical value is compared with the statistical test result. This comparison helps decide whether the observed data distribution varies significantly from the expected distribution. Researchers can use it to make statistical inferences about the relationship between categorical variables.
The critical value essentially sets a threshold for the alpha level at which one would reject the null hypothesis. The null hypothesis is rejected if the calculated chi-square test statistic exceeds the χ2 critical value. This implies that the observed data deviates significantly from the expected distribution.
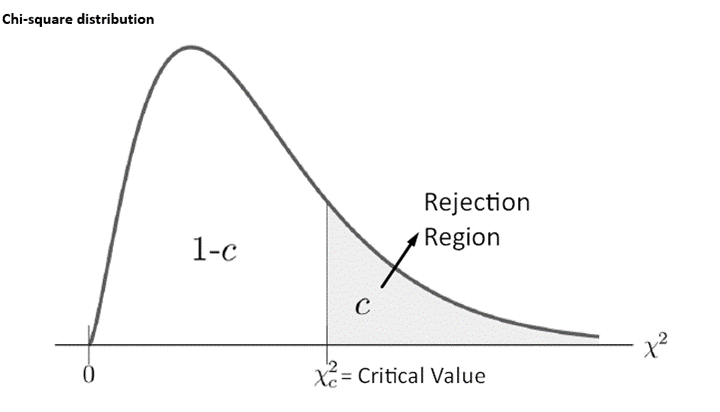
On a graph, the chi-square critical value cut the χ2 distribution into the acceptance and rejection region.

The Role of the Critical Value in Hypothesis Testing
Understanding the Hypothesis Testing Framework
Hypothesis testing is a fundamental concept in statistics used to make data-driven decisions. It provides a structured approach to determining whether an observed effect is statistically significant or if it occurred by chance. The process follows a systematic framework:
- Define the null hypothesis (\(H_0\)) and alternative hypothesis (\(H_1\)).
- Choose an appropriate statistical test (such as the chi-square test).
- Set a significance level (\(\alpha\)), often 0.05 or 0.01.
- Compute the test statistic from the sample data.
- Compare the test statistic to the critical value to make a decision.
Null Hypothesis (\(H_0\)) and Alternative Hypothesis (\(H_1\))
The null hypothesis (\(H_0\)) represents the default assumption that there is no significant effect or difference. It states that any observed variation is due to random chance.
Conversely, the alternative hypothesis (\(H_1\)) suggests that there is a statistically significant effect or difference that is not due to random chance.
For example, suppose a company wants to determine whether customer preferences for a product differ across regions. The hypotheses might be:
- \(H_0\): Customer preferences are independent of region.
- \(H_1\): Customer preferences vary by region.
The p-Value and Its Relationship to the Critical Value
In hypothesis testing, the p-value measures the probability of obtaining test results at least as extreme as the observed data, assuming \(H_0\) is true. A lower p-value indicates stronger evidence against \(H_0\).
The critical value is the threshold that defines the rejection region. If the test statistic exceeds this value, \(H_0\) is rejected in favor of \(H_1\).
These two concepts are closely related:
- If p-value \( \leq \alpha \), reject \(H_0\).
- If test statistic \( > \) critical value, reject \(H_0\).
- Both methods lead to the same conclusion in well-designed tests.
What the Critical Value Tells Us About Rejecting or Failing to Reject \(H_0\)
The critical value helps us decide whether to reject \(H_0\) or fail to reject it. If the test statistic:
- Falls beyond the critical value, we reject \(H_0\), suggesting a statistically significant effect.
- Falls within the acceptance region, we fail to reject \(H_0\), meaning there is not enough evidence to support \(H_1\).
For example, in a chi-square test with a significance level of 0.05 and 3 degrees of freedom, the critical value from the chi-square distribution table is 7.815. If the calculated test statistic is 9.2, it exceeds the critical value, leading to rejection of \(H_0\).
Thus, the critical value acts as a benchmark for decision-making in statistical inference.
How to Calculate Chi-Square Critical Value?
Follow the following three steps to calculate chi square critical value for the desired hypothesis test through the statistical table.
Define the Significance Level (Alpha)
The level of significance (indicated by α) is the probability of rejecting the null hypothesis (H0) when it is true. Commonly used values for alpha are 0.05, 0.01, or 0.10.
Identify the Degrees of Freedom
Degrees of freedom (df) in chi-square tests are determined by the number of categories or groups minus one. It depends on the types of chi-square tests.
df = (rows − 1) × (columns − 1).
Look up the chi-square distribution table
Use a chi-square distribution table to find the critical value of chi-square for the degrees of freedom and level of significance. Find the intersection of the row corresponding to the degrees of freedom and the column corresponding to the chosen significance level (alpha).
The interstation of its row and column is χ2– critical value.
Formulas for Finding Chi-Square Test
The chi-square test statistic calculation varies depending on the type of data examined. The chi-square test formula is as follows:
χ² = ∑ [(Oi – Ei)² / Ei]
Where:
- χ² stands for a chi-square test statistic
- Oi denotes the actual number of observations within a category
- Ei symbolizes the expected frequency
How can I Conduct the Chi-Square Test?
Here is a step-by-step guide on how to conduct a chi-square test:
- Formulate Hypotheses: State the null hypothesis (stating no association between the variables) and alternative hypothesis
- Collect Data and Create a Contingency Table: Obtain data that includes the frequencies or counts for each category of the two categorical variables. Write the data into a contingency table. This table will have rows and columns corresponding to the categories of the two variables.
Category 1 | Category 2 | … | Category n | Row Total | |
Variable 1 | Observed | Observed | … | Observed | |
Variable 2 | Observed | Observed | … | Observed | |
… | … | … | … | … | |
Column Total | … | Grand Total |
- Find Expected Frequencies: Use the following formula to compute expected frequencies for each cell in a contingency table for a chi-square test.
Ei = (Row total × Column total)/Grand total
- Find the Chi-Square Statistic value:
Use the formula and substitute the value for the chi-square statistic.
χ² = ∑ [(Oi – Ei)² / Ei]
- Determine the Chi-Square Critical Value:
Find the critical value of chi-square by following the above-explained steps.
- Compare Chi-Square Statistic with Critical Value and Make a Decision:
If the calculated chi-square statistic is greater than the chi-square critical value, reject the null hypothesis and conclude that there is a significant relationship between the given variables.
Example of Chi-Square
Example:
A researcher wants to investigate whether there is a significant association between hair color and eye color. They collect data from 165 participants.
Blue Eyes | Brown Eyes | Black Eyes | |
Brown Hair | 30 | 20 | 10 |
Gray Hair | 20 | 25 | 15 |
Black Hair | 10 | 15 | 20 |
Solution:
Step 1: Set up the hypothesis.
H0: There is no connection between hair color and eye color.
H1: There is a relationship between hair and eye color
Step 2: Set up the level of significance.
Let’s assume alpha = 0.05
Step 3: Calculate the total value for each column and row in a table.
Blue Eyes | Brown Eyes | Black Eyes | Row Total | |
Brown Hair | 30 | 20 | 10 | 60 |
Gray Hair | 20 | 25 | 15 | 60 |
Black Hair | 10 | 15 | 20 | 45 |
Column Total | 60 | 60 | 45 | Grand Total = 165 |
Step 4: Determine the expected values using the given formula.
∴ Ei = (Row total × Column total)/Grand total
Blue Eyes | Brown Eyes | Black Eyes | |
Brown Hair | (60 × 60) / 165 = 21.818 | (60 × 60) / 165 = 21.818 | (45 × 60) / 165 = 16.364 |
Gray Hair | (60 × 60) / 165 = 21.818 | (60 × 60) / 165 = 21.818 | (45 × 60) / 165 = 16.364 |
Black Hair | (60 × 45) / 165 = 16.364 | (60 × 45) / 165 = 16.364 | (45 × 45) / 165 = 12.273 |
Step 5: Calculate the chi-square test statistical value.
∴ χ² = ∑ [(Oi – Ei)² / Ei]
| Blue Eyes | Brown Eyes | Black Eyes |
Brown Hair | (30 – 21.818)2/21.818 = 3.068 | (20 – 21.818)2/21.818 = 0.152 | (10 – 16.364)2/16.364 =2.475 |
Gray Hair | (20 – 21.818)2/21.818 = 0.152 | (25 – 21.818)2/21.818 = 0.464 | (15 – 16.364)2 /16.364= 0.114 |
Black Hair | (10 – 16.364)2/16.364 = 2.475 | (15 – 16.364)2/16.364= 0.114 | (20 – 12.273)2/12.273= = 4.865 |
χ² = 3.068 + 0.152 + 2.475 + 0.152+ 0.464 + 0.114 + 2.475 + 0.114 + 4.865
χ² = 13.879
Step 6: Compute the degrees of freedom (df).
∴ df = (number of rows – 1) × (number of columns – 1)
df = (3 – 1) × (3 – 1) = 4
Step 7: Evaluate the Chi-Square critical value.
Find the chi-square critical value through the chi-square distribution table by using alpha 0.05 with 4 degrees of freedom.
df | α = 0.10 | α = 0.05 | α = 0.01 |
1 | 2.706 | 3.841 | 6.635 |
2 | 4.605 | 5.991 | 9.210 |
3 | 6.251 | 7.815 | 11.345 |
4 | 7.779 | 9.488 | 13.277 |
5 | 9.236 | 11.070 | 15.086 |
The intersection of 4 and 0.05 is 9.488. So
Chi-square critical value = 9.488
Step 8: Make a decision.
Reject the null hypothesis since the calculated χ2 is greater than the critical χ2. Therefore, we can conclude that there is an association between hair color and eye color in the population.
Conclusion
In this article, we have explored the definition of the chi-square critical value and how to determine it using a table. We discussed the formula for calculating the chi-square test and examined the process of performing the chi-square test to make decisions about two categorical variables. Examples will help you understand how to apply these concepts numerically.